Fig. 12
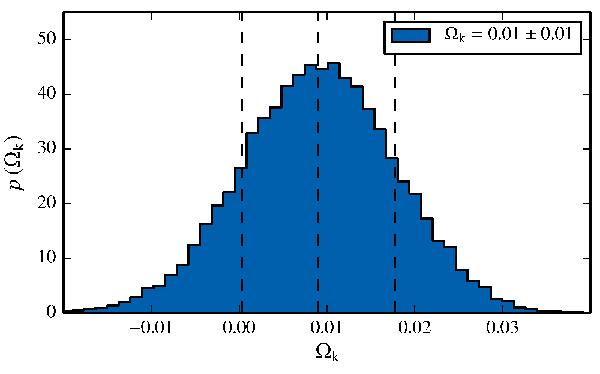
Posterior distribution of the spatial curvature of the background model, marginalised over fluctuations in the matter density profile at radii r< 3 Gpc. The black dashed lines indicate the mean value and the corresponding ± 1σ boundaries. The models were constrained by data from the local Hubble rate, supernovae, the CMB, and kSZ clusters.
Current usage metrics show cumulative count of Article Views (full-text article views including HTML views, PDF and ePub downloads, according to the available data) and Abstracts Views on Vision4Press platform.
Data correspond to usage on the plateform after 2015. The current usage metrics is available 48-96 hours after online publication and is updated daily on week days.
Initial download of the metrics may take a while.