Fig. 4
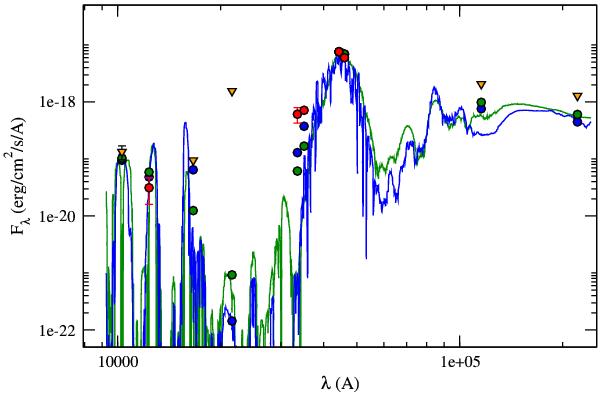
Spectral energy distribution of WISE0855. Yellow triangles show the magnitude upper limits in Y (this work) and H, KS, W3, and W4 (Luhman 2014b; Wright et al. 2014). Red circles show measurements from J band (Faherty et al. 2014b); WISE bands W1,W2 and Spitzer IRAC channels 1 and 2. Blue and green points represent the magnitudes derived from convolving the synthetic spectrum with the corresponding filter transmission curves for each model. Finally, the blue curve is the best fitting BT-settl model with temperature Teff = 240 K, log g = 4, and radius R = 1.17RJup, conforming to all upper limits, and the green curve is the best fitting Morley et al. (2014) model, with Teff = 250 K, log g = 4, fsed = 7, and 50% of cloud coverage (see Morley et al. 2014 for more details in the parameters). See Sect. 3 for detailed description of the models.
Current usage metrics show cumulative count of Article Views (full-text article views including HTML views, PDF and ePub downloads, according to the available data) and Abstracts Views on Vision4Press platform.
Data correspond to usage on the plateform after 2015. The current usage metrics is available 48-96 hours after online publication and is updated daily on week days.
Initial download of the metrics may take a while.