Fig. 3
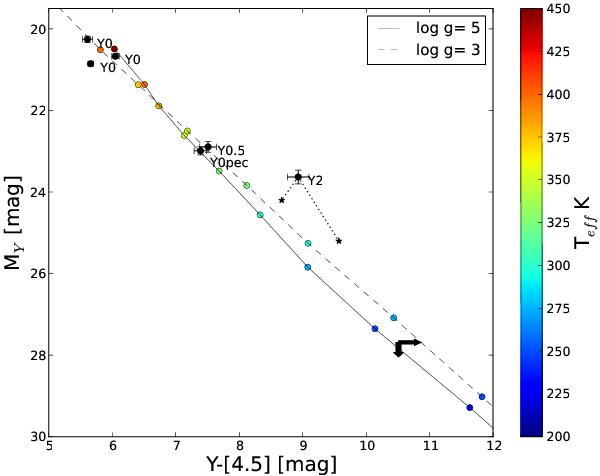
Absolute color magnitude diagram of Y dwarfs with available measurements in the Y-band filter from Leggett et al. (2013). A color shift was not applied to account for differences in the pass-band from Gemini-NIRI data to VLT-HAWK-I data; distances were taken from Leggett et al. (2013) and Beichman et al. (2014). The arrow at the bottom right shows the upper limit presented in this work, making WISE0855 the reddest BD. The stars show the individual components of the tentative Y2 binary (WISEPCJ1828+2650), proposed to explain the over-luminosity in the mid infrared. Colored points shows two of the models from Morley et al. (2014), with 50% cloud coverage, a sedimentation factor fsed = 5, and log g = 3 and 5, connected with black dashed and solid line for clarity.
Current usage metrics show cumulative count of Article Views (full-text article views including HTML views, PDF and ePub downloads, according to the available data) and Abstracts Views on Vision4Press platform.
Data correspond to usage on the plateform after 2015. The current usage metrics is available 48-96 hours after online publication and is updated daily on week days.
Initial download of the metrics may take a while.