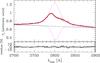
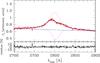
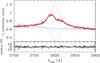
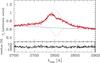
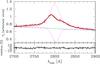
Fig. 4

Best fit and residuals for five observations, model M (see Table 3 for model parameters); continuous lines show the model and the data, dashed lines give the underlying power law, the dotted blue line represents the kinematically blurred Fe II pseudo-continuum, and dotted magenta lines mark the emission and absorption components of the Mg II.
Current usage metrics show cumulative count of Article Views (full-text article views including HTML views, PDF and ePub downloads, according to the available data) and Abstracts Views on Vision4Press platform.
Data correspond to usage on the plateform after 2015. The current usage metrics is available 48-96 hours after online publication and is updated daily on week days.
Initial download of the metrics may take a while.