Free Access
Fig. 1
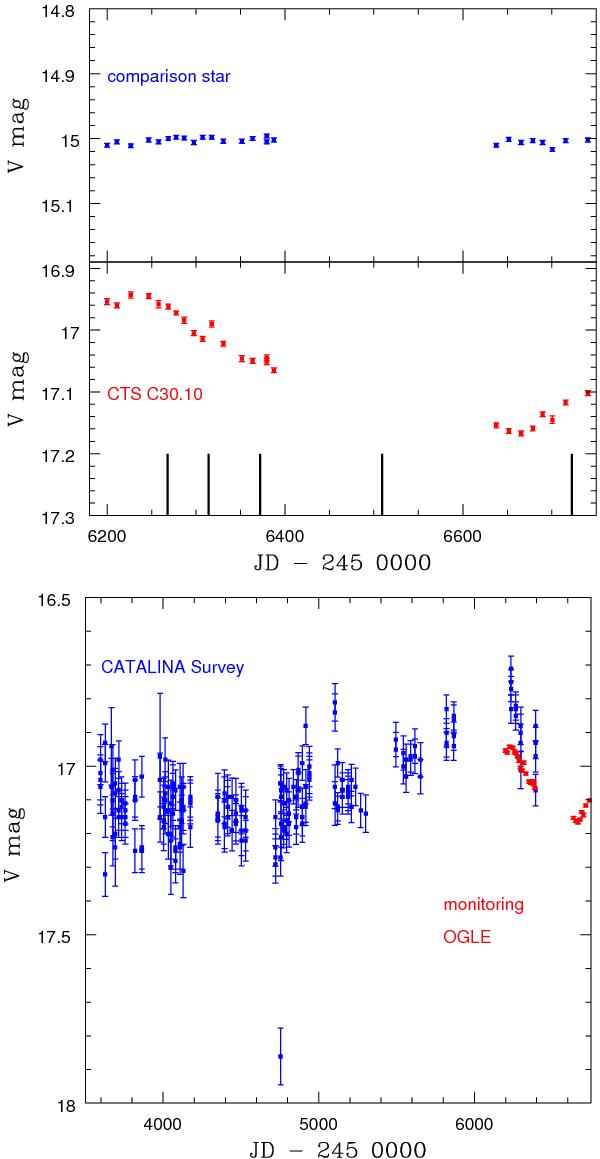
V-band light curve of CTS C30.10 (middle panel) and one for the comparison star (upper panel) from OGLE monitoring, with times of spectroscopic measurements shown by vertical lines. The lower panel shows the Catalina lightcurve, together with the OGLE lightcurve.
This figure is made of several images, please see below:
Current usage metrics show cumulative count of Article Views (full-text article views including HTML views, PDF and ePub downloads, according to the available data) and Abstracts Views on Vision4Press platform.
Data correspond to usage on the plateform after 2015. The current usage metrics is available 48-96 hours after online publication and is updated daily on week days.
Initial download of the metrics may take a while.