Fig. 8
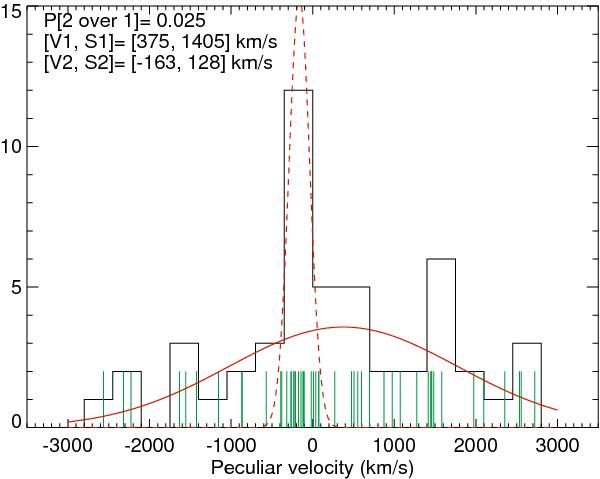
The histogram shows the peculiar velocity distribution of the 50 galaxies within | vpec | < 3500 km s-1 and ~ 550 kpc of the tip of the NE X-ray feature. The green vertical lines show the vpec positions of each of the 50 galaxies. The solid red and dashed red lines show the main and second Gaussian components from the KMM fit described in Sect. 3.3. The best fitting mean and dispersions are listed at the top left of the plot, along with the P-value giving the probability that the observed LRTS of the bimodal to the unimodal fit is due to random fluctuations in a unimodal distribution.
Current usage metrics show cumulative count of Article Views (full-text article views including HTML views, PDF and ePub downloads, according to the available data) and Abstracts Views on Vision4Press platform.
Data correspond to usage on the plateform after 2015. The current usage metrics is available 48-96 hours after online publication and is updated daily on week days.
Initial download of the metrics may take a while.