Free Access
Fig. 7
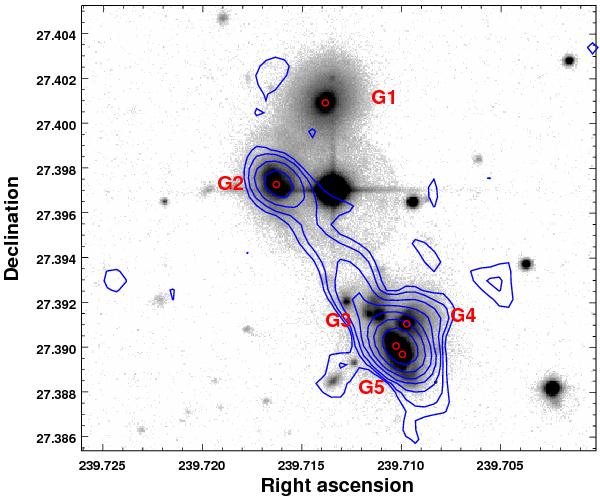
Same as Fig. 3 (right), zoom on the tip of the X-ray emission. The red circles indicate the position of the spectra from the study of Owers et al. (2011). The blue contours show the 610 MHz radio emission observed by GMRT (see Sect. 3.4).
Current usage metrics show cumulative count of Article Views (full-text article views including HTML views, PDF and ePub downloads, according to the available data) and Abstracts Views on Vision4Press platform.
Data correspond to usage on the plateform after 2015. The current usage metrics is available 48-96 hours after online publication and is updated daily on week days.
Initial download of the metrics may take a while.