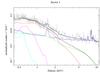
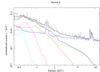
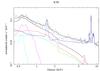
Fig. 6
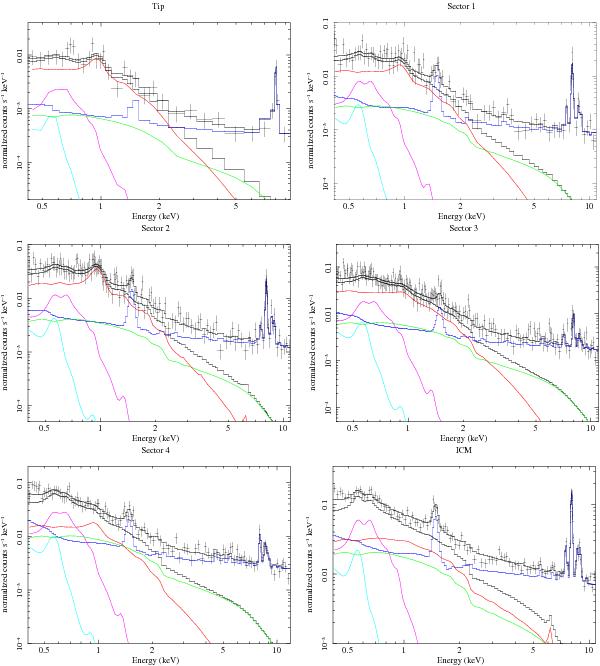
First and second rows: EPIC/pn spectra for the regions defined in Fig. 5 (the fits were performed jointly on all 3 EPIC instruments, however only pn is shown here for clarity). The solid lines show the various components used for the fitting procedure: the source (red), the NXB (blue), the CXB (green), the Galactic halo emission (magenta), and the local hot bubble (cyan). Bottom right: EPIC/pn spectrum of the local ICM in the region close to the tip of the infalling group. The color code is the same as above.
Current usage metrics show cumulative count of Article Views (full-text article views including HTML views, PDF and ePub downloads, according to the available data) and Abstracts Views on Vision4Press platform.
Data correspond to usage on the plateform after 2015. The current usage metrics is available 48-96 hours after online publication and is updated daily on week days.
Initial download of the metrics may take a while.