Fig. 1
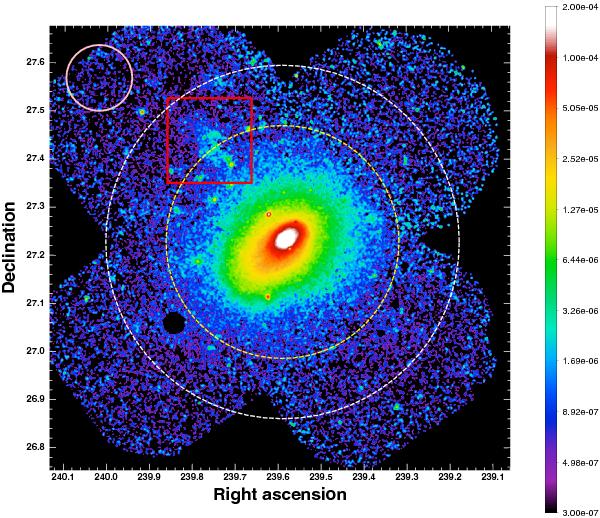
Exposure-corrected, NXB-subtracted combined XMM-Newton/ EPIC mosaic image of A2142 in the [0.7–1.2] keV band, smoothed with a Gaussian of width 15 arcsec. The units for the color bar are MOS counts s-1. The dashed circles show the approximate locations of R500 and R200, while the red square indicates the position of a newly discovered X-ray substructure in this cluster. The pink circle in the top left corner shows the region used to estimate the local background components.
Current usage metrics show cumulative count of Article Views (full-text article views including HTML views, PDF and ePub downloads, according to the available data) and Abstracts Views on Vision4Press platform.
Data correspond to usage on the plateform after 2015. The current usage metrics is available 48-96 hours after online publication and is updated daily on week days.
Initial download of the metrics may take a while.