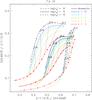
Fig. 8
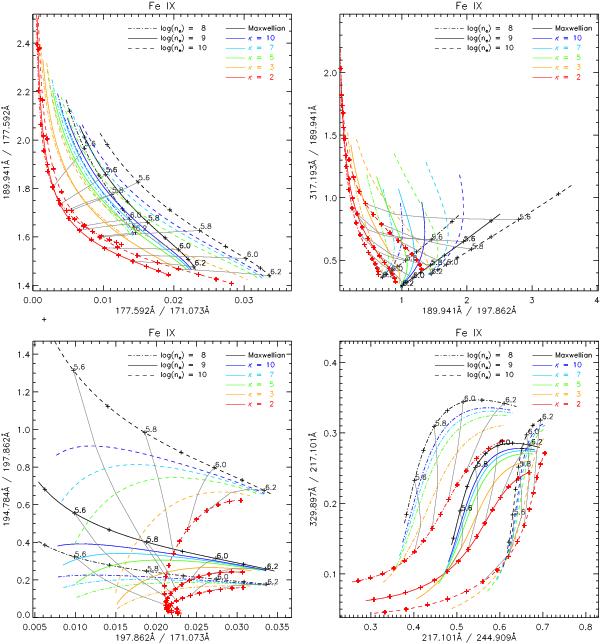
Examples of the theoretical plots for simultaneous diagnostics of T and κ from Fe ix. Both axes show intensity ratios of two lines, with the line intensities in the units of phot cm-2 s-1 sr-1. Individual line styles correspond to different log(ne/ cm3), colors to individual values of κ, and gray lines denote isotherms connecting points having the same log(T/K).
Current usage metrics show cumulative count of Article Views (full-text article views including HTML views, PDF and ePub downloads, according to the available data) and Abstracts Views on Vision4Press platform.
Data correspond to usage on the plateform after 2015. The current usage metrics is available 48-96 hours after online publication and is updated daily on week days.
Initial download of the metrics may take a while.