Fig. 4
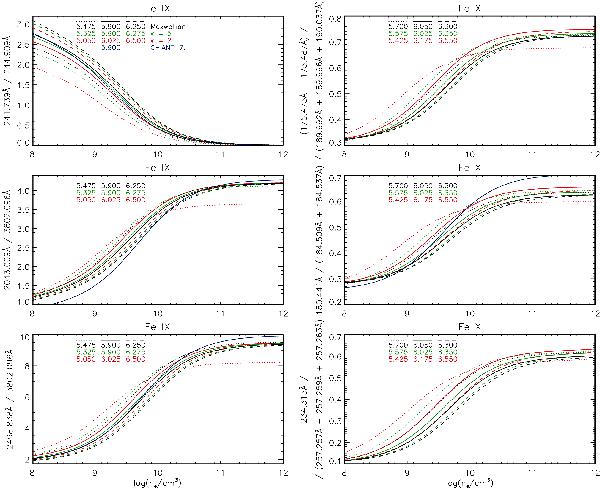
Electron density diagnostics from Fe ix and Fe x. Intensity ratios of two lines are shown. The intensity units are phot cm-2 s-1 sr-1. Black lines correspond to the Maxwellian distribution, green to κ = 5, and red to κ = 2. Individual line styles are used to denote the T-dependence of the density diagnostics. Blue lines denote the same ratio according to the atomic data from CHIANTI v7.1.
Current usage metrics show cumulative count of Article Views (full-text article views including HTML views, PDF and ePub downloads, according to the available data) and Abstracts Views on Vision4Press platform.
Data correspond to usage on the plateform after 2015. The current usage metrics is available 48-96 hours after online publication and is updated daily on week days.
Initial download of the metrics may take a while.