Fig. 4
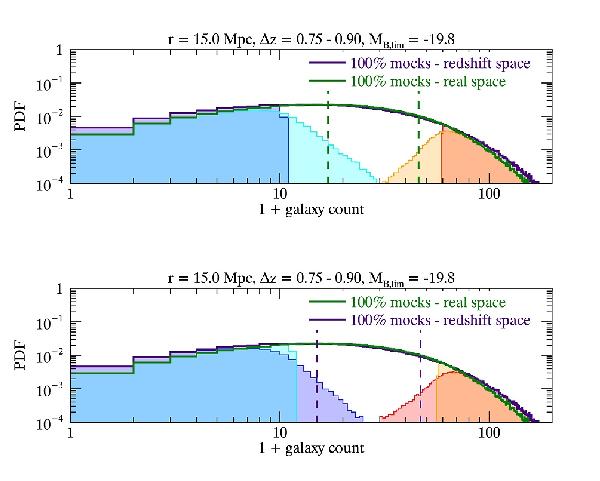
Counts-in-cells distributions in the mock samples in redshift bin 0.75 <z< 0.9 for cells of radius r = 15 Mpc. The green line shows the distribution of counts in real space while the violet line shows the distribution in redshift space (extending slightly to higher counts). Top panel: cells are selected in redshift space. Blue and red shaded regions represent the 15% least and most populated cells in the redshift space sample, respectively. In real space the distribution of these cells are shown by the cyan and orange shaded regions. The vertical dashed line indicates the 25th and 75th percentiles of the real space distribution. Bottom panel: vice versa, cells are selected in real space and viewed in redshift space. The vertical dashed line indicates the 25th and 75th percentiles of the redshift space distribution.
Current usage metrics show cumulative count of Article Views (full-text article views including HTML views, PDF and ePub downloads, according to the available data) and Abstracts Views on Vision4Press platform.
Data correspond to usage on the plateform after 2015. The current usage metrics is available 48-96 hours after online publication and is updated daily on week days.
Initial download of the metrics may take a while.