Fig. 13
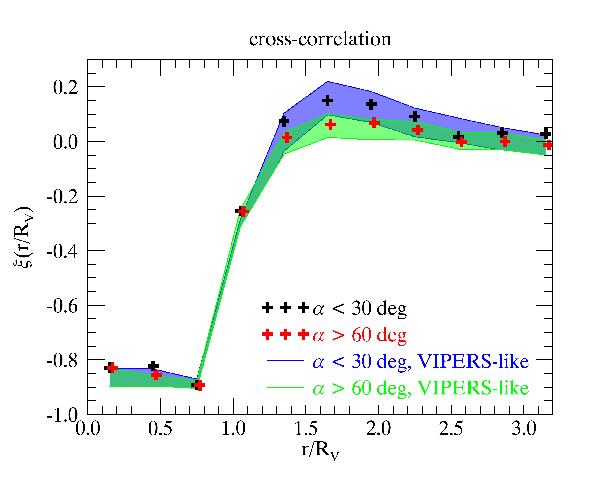
Angle-average void-galaxy correlation function as a function of radial distance normalised to the void radius. To demonstrate the anisotropy we average over two angular wedges, along the line of sight (α< 30°, black line) and transverse to the line of sight (α> 60°, red line). The shaded regions represent the spread of values measured in the mocks. The enhancement along the line-of-sight is an indication of the redshift-space distortion produced by the outflow of galaxies from voids.
Current usage metrics show cumulative count of Article Views (full-text article views including HTML views, PDF and ePub downloads, according to the available data) and Abstracts Views on Vision4Press platform.
Data correspond to usage on the plateform after 2015. The current usage metrics is available 48-96 hours after online publication and is updated daily on week days.
Initial download of the metrics may take a while.