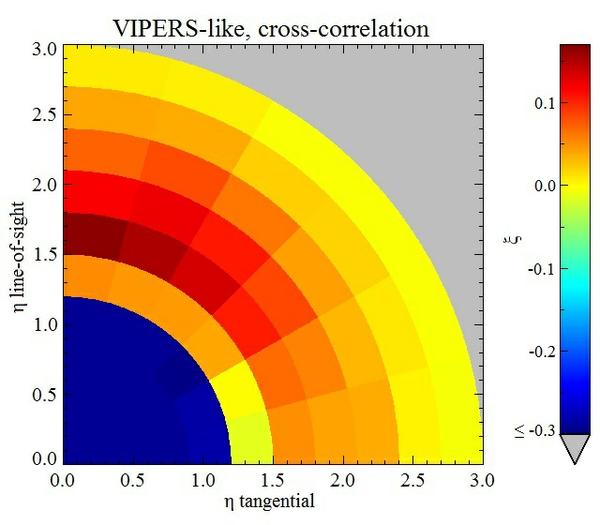
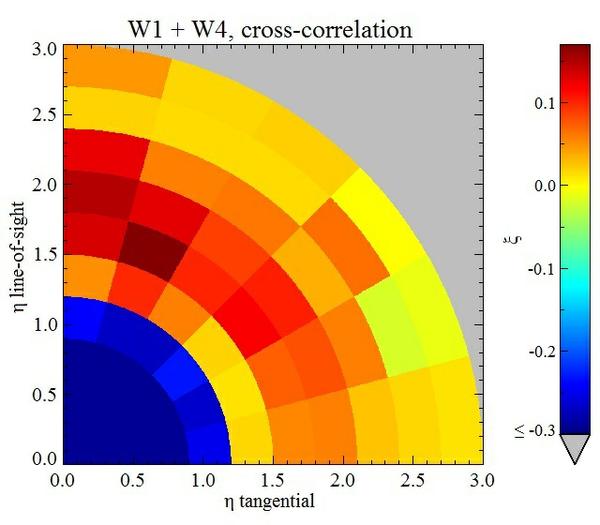
Fig. 12
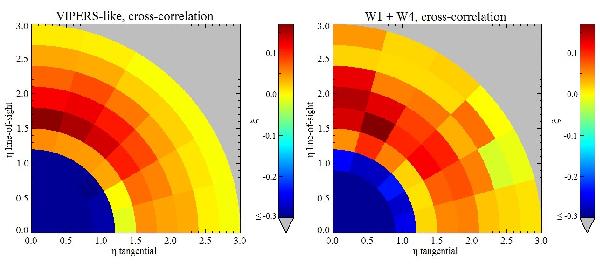
Void-galaxy cross-correlation function, as measured in the mock catalogues (left panel) and in the VIPERS data (right panel). Measurements were made in ten radial bins and in six angular bins. The axes plotted correspond to the tangential, θ, and line of sight, π, directions. The enhancement in the line of sight direction, visible in both the mock catalogues and in the data, is evidence of redshift space distortions caused by linear outflows.

Current usage metrics show cumulative count of Article Views (full-text article views including HTML views, PDF and ePub downloads, according to the available data) and Abstracts Views on Vision4Press platform.
Data correspond to usage on the plateform after 2015. The current usage metrics is available 48-96 hours after online publication and is updated daily on week days.
Initial download of the metrics may take a while.