Free Access
Fig. 13
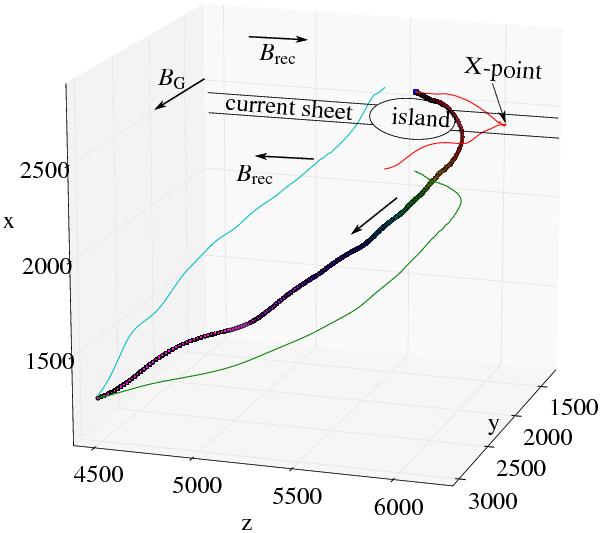
Typical trajectory for a particle, here an electron, for simulation with  . Axis scales are given in cell numbers, with 9 cells representing one initial electron inertial length. Dot colors are the particle Lorentz factor, from 1 to 60 here. Solid lines are projections onto the x-y, y-z, and z-x planes.
Current usage metrics show cumulative count of Article Views (full-text article views including HTML views, PDF and ePub downloads, according to the available data) and Abstracts Views on Vision4Press platform.
Data correspond to usage on the plateform after 2015. The current usage metrics is available 48-96 hours after online publication and is updated daily on week days.
Initial download of the metrics may take a while.