Fig. 5
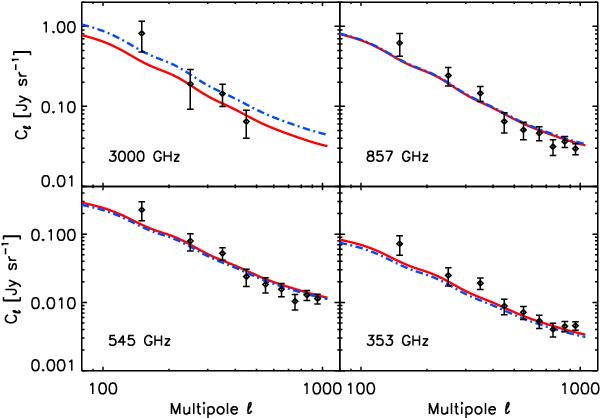
Cross-power spectra measurements among CIB maps at 3000, 857, 545, and 353 GHz, and CMASS LRGs (black points); for the IRIS 3000 GHz channel we did not use data points at multipoles l > 500. Best-fit power spectra are shown for the parametric SED functional form (red lines) and for the effective SED (blue dashed-dotted lines).
Current usage metrics show cumulative count of Article Views (full-text article views including HTML views, PDF and ePub downloads, according to the available data) and Abstracts Views on Vision4Press platform.
Data correspond to usage on the plateform after 2015. The current usage metrics is available 48-96 hours after online publication and is updated daily on week days.
Initial download of the metrics may take a while.