Fig. 6
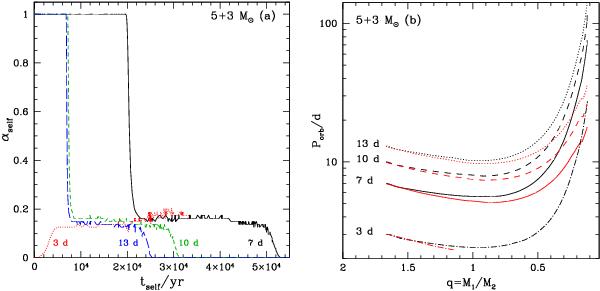
a) Evolution of αself as a function of time, tself, since the start of self-accretion for a 5 + 3 M⊙ system, with an initial orbital period, Pi of 3 d (dotted red curve), 7 d (solid black), 10 d (green short dashed) and 13 d (blue long-dashed). b) Evolution of the orbital period, Porb, as a function of q = M1/M2, for different initial orbital periods: 3 d (dot-dashed); 7 d (solid); 10 d (short-dashed) and 13 d (dotted). Black curves refer to classical calculations, and the red lines to the osculating scheme.
Current usage metrics show cumulative count of Article Views (full-text article views including HTML views, PDF and ePub downloads, according to the available data) and Abstracts Views on Vision4Press platform.
Data correspond to usage on the plateform after 2015. The current usage metrics is available 48-96 hours after online publication and is updated daily on week days.
Initial download of the metrics may take a while.