Fig. 4
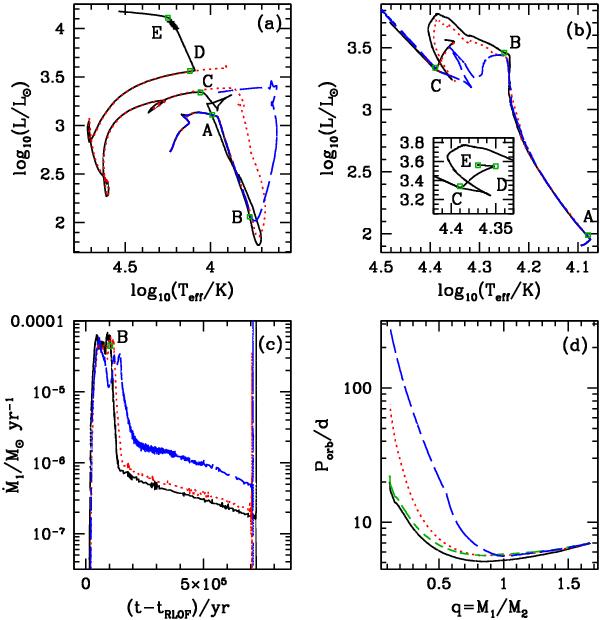
Evolution of the 5 + 3 M⊙ system, Pi = 7 d, calculated using the osculating (solid black curves) and the classical (dotted red curves) prescriptions. The short-dashed green and the long-dashed blue curves also use the osculating scheme, but  and ℱstream have been set to zero, respectively. For clarity, the dashed green curve has been omitted from panels a) to c) as it is indistinguishable from the black curve. The long-dashed blue curve has been truncated in panel a), since it follows the same track as the black and red curves during core-He burning. Panels a) and b) show the evolutionary path in the Hertzsprung-Russel diagram of the primary and secondary. Panel c) shows the mass loss rate, Ṁ1, as a function of time since mass transfer started and panel d) the evolution of the orbital period, Porb, as a function of the mass ratio, q = M1/M2. The different evolutionary phases are indicated by the open green squares, and are labelled as follows: A: start of case B mass transfer; B: q = 1; C: end of case B mass transfer (coincides with the end of H-shell burning); D: start of case BB mass transfer (onset of He-core burning); E: end of case BB mass transfer (onset of He-shell burning).
Current usage metrics show cumulative count of Article Views (full-text article views including HTML views, PDF and ePub downloads, according to the available data) and Abstracts Views on Vision4Press platform.
Data correspond to usage on the plateform after 2015. The current usage metrics is available 48-96 hours after online publication and is updated daily on week days.
Initial download of the metrics may take a while.