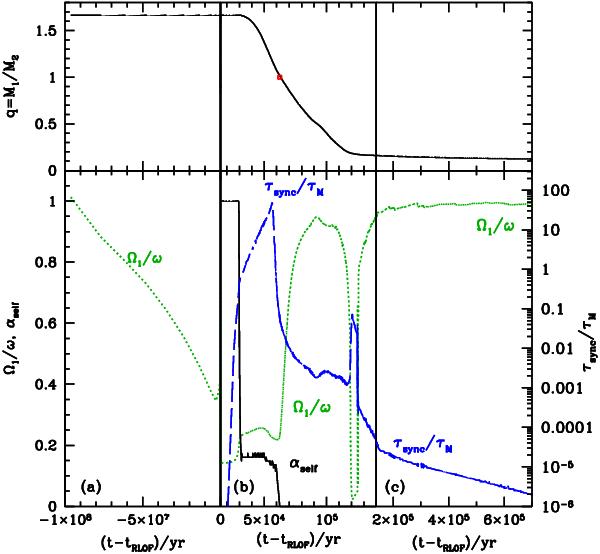
Fig. 2

Evolution in time (since the start of mass transfer at tRLOF = 9.62034 × 10⁷ yr) of the primary’s spin angular velocity in units of the orbital velocity, Ω1/ω (dotted green curve, left axis), for the 5 + 3 M⊙ system, initial period Pi = 7 d, using the osculating formalism. Panel a): as the primary evolves off the main sequence up to the onset of mass transfer; panel b): during the self-accretion phase; panel c): during the slow mass transfer phase. Panel b) also shows the fraction of ejected material that falls back onto the primary, αself (solid black curve, left axis), and the ratio of the tidal synchronization timescale to the mass transfer timescale, τsync/τṀ (dashed blue curve, right axis). Note the change in scales along the x-axis in each panel. The top panels indicate the evolution of q = M1/M2, and the open red square indicates where q = 1.
Current usage metrics show cumulative count of Article Views (full-text article views including HTML views, PDF and ePub downloads, according to the available data) and Abstracts Views on Vision4Press platform.
Data correspond to usage on the plateform after 2015. The current usage metrics is available 48-96 hours after online publication and is updated daily on week days.
Initial download of the metrics may take a while.


