Fig. 5
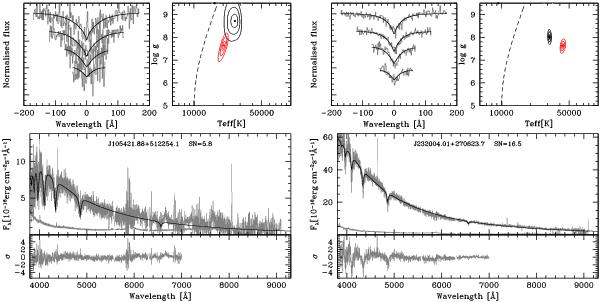
Spectral model fits to the white dwarf components of the two DA/M binaries shown in Fig. 4, obtained after subtracting the best-fit M-dwarf template. Top left panels: best-fit (black lines) to the normalised Hβ to Hϵ (grey lines, top to bottom) line profiles. Top right panels: 3, 5, and 10σχ2 contour plots in the Teff − log g plane. The black contours refer to the best line profile fit, the red contours to the fit of the whole spectrum. The dashed line indicates the occurrence of maximum Hβ equivalent width. The best “hot” and “cold” line profile solutions are indicated by black dots, the best fit to the whole spectrum is indicated by a red dot. Bottom panels: residual white dwarf spectra resulting from the spectral decomposition and their flux errors (grey lines) along with the best-fit white dwarf model (black line) to the 3800–7000 λλ wavelength range (top) and the residuals of the fit (grey line, bottom). The Teff and log g values listed in Table 1 are determined from the best line profile fit. The fit to the whole spectrum is only used to select between the “hot” and “cold” line fit.
Current usage metrics show cumulative count of Article Views (full-text article views including HTML views, PDF and ePub downloads, according to the available data) and Abstracts Views on Vision4Press platform.
Data correspond to usage on the plateform after 2015. The current usage metrics is available 48-96 hours after online publication and is updated daily on week days.
Initial download of the metrics may take a while.