Fig. 7
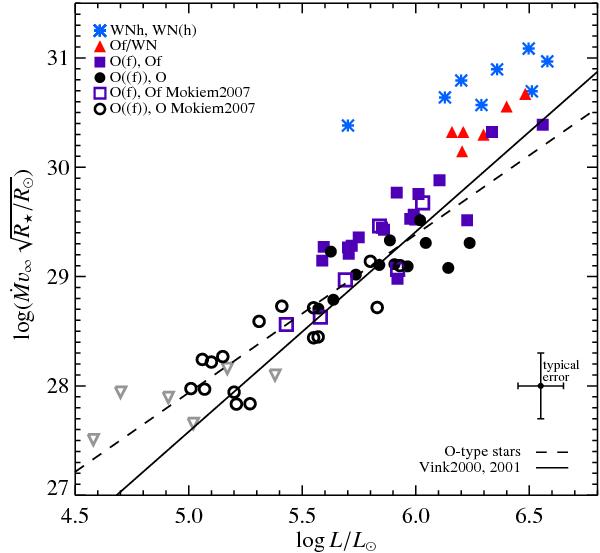
Unclumped wind momentum versus luminosity for the combined sample from this work and Mokiem et al. (2007). The different symbols indicate stellar sub-classes following Sect. 4.1. The solid line shows the theoretical prediction by Vink et al. (2000, 2001). The dashed line is a fit through the O-type stars including both samples. The grey triangles are stars from Mokiem et al. (2007) that have only an upper limit in Ṁ and are excluded from the fit.
Current usage metrics show cumulative count of Article Views (full-text article views including HTML views, PDF and ePub downloads, according to the available data) and Abstracts Views on Vision4Press platform.
Data correspond to usage on the plateform after 2015. The current usage metrics is available 48-96 hours after online publication and is updated daily on week days.
Initial download of the metrics may take a while.