Fig. 3
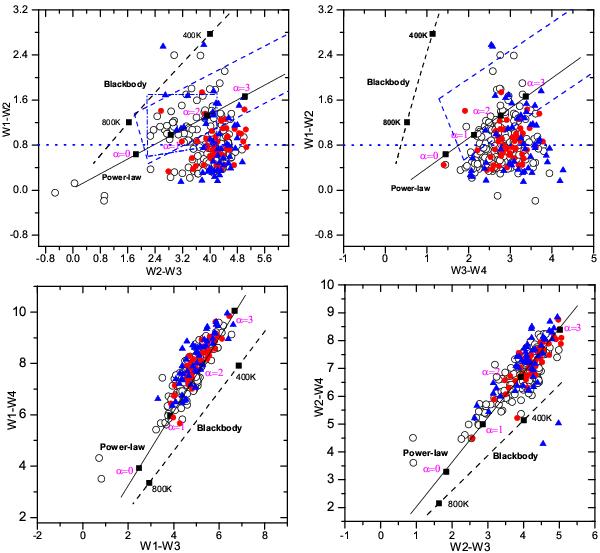
WISE color−color diagrams (upper left: [ W1 ] − [ W2 ] vs. [ W2 ] − [ W3 ],upper right: [ W1 ] − [ W2 ] vs. [ W3 ] − [ W4 ]; lower left: [ W1 ] − [ W4 ] vs. [ W1 ] − [ W3 ], lower right: [ W2 ] − [ W4 ] vs. [ W2 ] − [ W3 ]) for OHMs and non-OHM sources. All symbols are the same as Fig. 2. The dashed lines show results from the blackbody model at different temperatures (squares for typical temperature values) and the solid lines present results from the power-law model with different spectral index (F ∝ ν− α, four typical spectral index of 0, 1, 2, 3 are shown). Various AGN criteria were also shown in upper panels represented by dotted line (defined by Stern et al. 2012), a dashed line wedge (Mateos et al. 2012), and a dash-dotted line wedge (Jarrett et al. 2011), respectively.
Current usage metrics show cumulative count of Article Views (full-text article views including HTML views, PDF and ePub downloads, according to the available data) and Abstracts Views on Vision4Press platform.
Data correspond to usage on the plateform after 2015. The current usage metrics is available 48-96 hours after online publication and is updated daily on week days.
Initial download of the metrics may take a while.