Fig. 5
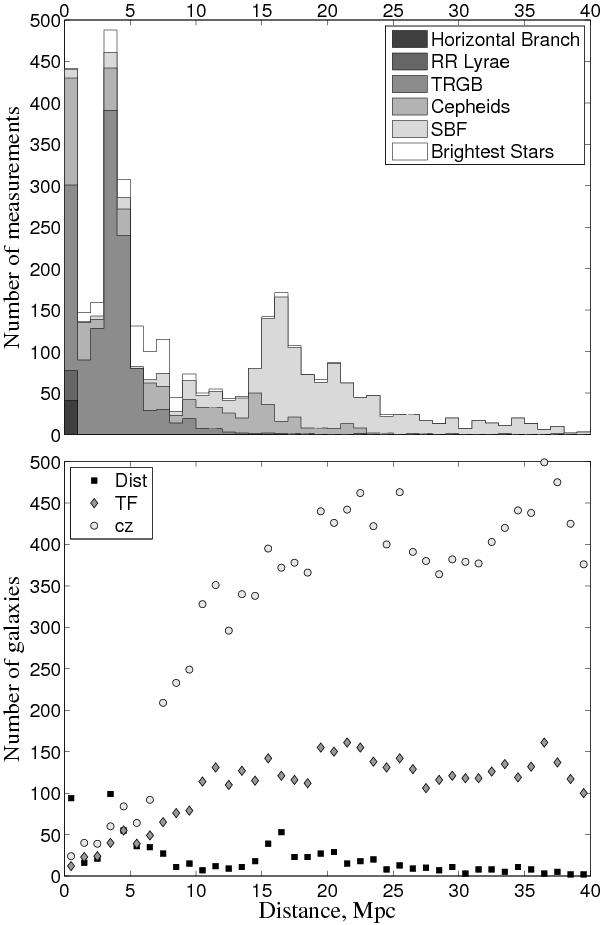
Top panel: distribution of the individual distance estimates versus distance. Only the five most significant methods, namely the horizontal branch, the RR Lyrae, the tip of the red giant branch (TRGB), the Cepheids, the surface brightness fluctuations (SBF), and the brightest stars, were considered to build the histogram. While the outer envelope shows the total number of measurements in each 1 Mpc bin, the different grey tones distinguish the contribution of each method. Bottom panel: distribution of the individual galaxies. The black squares correspond to objects with known redshift-independent distance estimate (Dist), excluding the scaling relations. The distributions of galaxies with Tully-Fisher data (TF) is shown by grey diamonds, and galaxies with known redshift, cz, are illustrated by open circles. TF is computed using the H i and photometric parameters of HyperLEDA, while the redshift is transformed into distance using the Hubble law.
Current usage metrics show cumulative count of Article Views (full-text article views including HTML views, PDF and ePub downloads, according to the available data) and Abstracts Views on Vision4Press platform.
Data correspond to usage on the plateform after 2015. The current usage metrics is available 48-96 hours after online publication and is updated daily on week days.
Initial download of the metrics may take a while.