Fig. 4
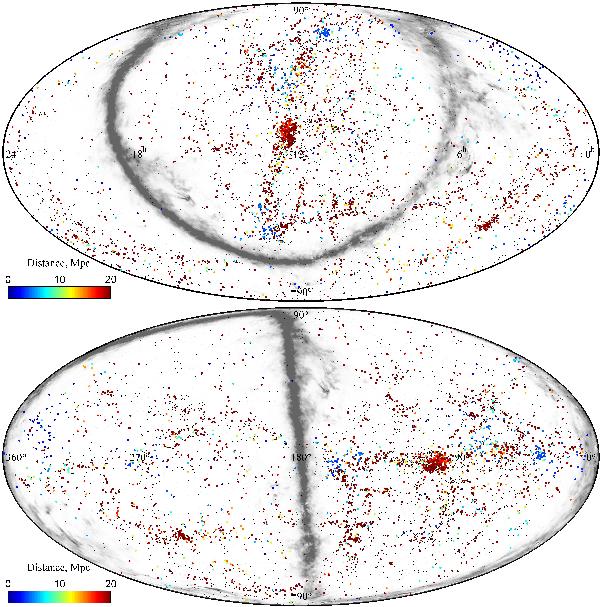
All-sky distribution of galaxies with known redshift-independent distance estimate in equatorial (top panel) and in supergalactic coordinates (bottom panel). The distance is shown by colour from nearby (blue) to distant (brown). The small black dots represent the distribution of galaxies on a scale of 40 Mpc. The zone of high extinction in the Milky Way is indicated in grey.
Current usage metrics show cumulative count of Article Views (full-text article views including HTML views, PDF and ePub downloads, according to the available data) and Abstracts Views on Vision4Press platform.
Data correspond to usage on the plateform after 2015. The current usage metrics is available 48-96 hours after online publication and is updated daily on week days.
Initial download of the metrics may take a while.