Fig. 1
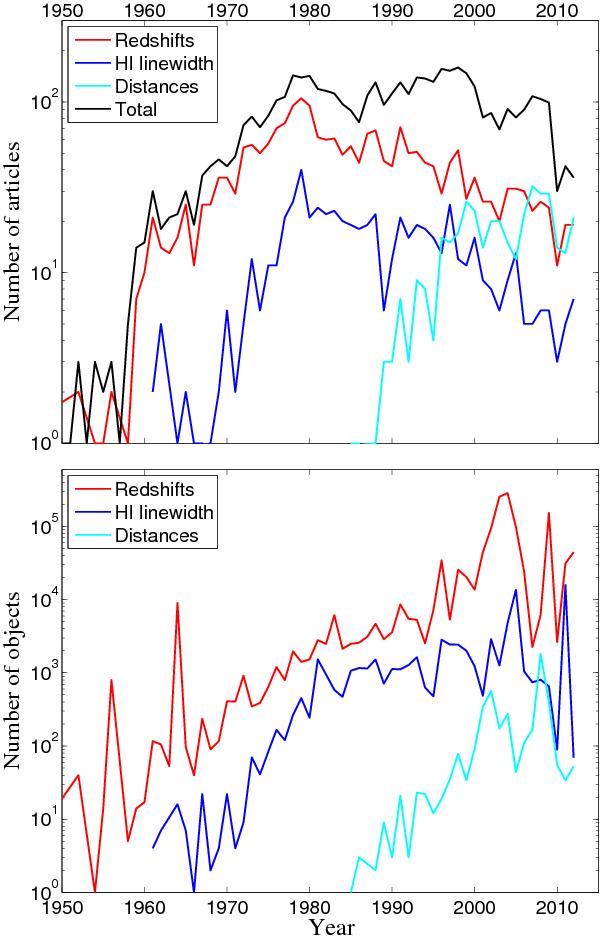
Year-by-year statistics of data ingestion and processing in HyperLEDA. The top panel shows the number of processed articles per year. The black line corresponds to the whole database, while individual compilation catalogues are shown by different colours: the redshift catalogue is red, the H i line width is blue, and the distance catalogue is cyan. The bottom panel shows the number of individual objects processed in the given year.
Current usage metrics show cumulative count of Article Views (full-text article views including HTML views, PDF and ePub downloads, according to the available data) and Abstracts Views on Vision4Press platform.
Data correspond to usage on the plateform after 2015. The current usage metrics is available 48-96 hours after online publication and is updated daily on week days.
Initial download of the metrics may take a while.