Fig. 7
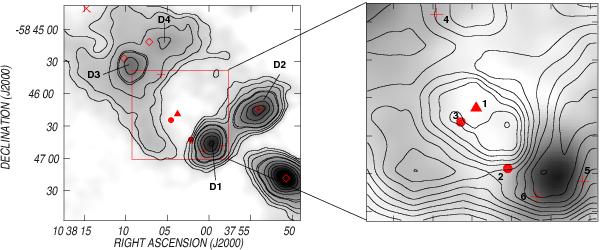
Left panel: 870 μm continuum emission map. Dust clumps are indicated. The grayscale goes from −0.1 to 2.0 Jy beam-1. Contour levels correspond to 0.2, 0.35, 0.5, and 0.7 Jy beam-1, and from 0.75 to 2.0 Jy beam-1 in steps of 0.25 Jy beam-1. The large square indicates the region observed in CO lines and the different symbols have the same meaning as in Fig. 6. Right panel: overlay of the emission at 870 μm (grayscale) and the CO contours of Fig. 6. IR sources listed in Table 3 are indicated.
Current usage metrics show cumulative count of Article Views (full-text article views including HTML views, PDF and ePub downloads, according to the available data) and Abstracts Views on Vision4Press platform.
Data correspond to usage on the plateform after 2015. The current usage metrics is available 48-96 hours after online publication and is updated daily on week days.
Initial download of the metrics may take a while.