Fig. 6
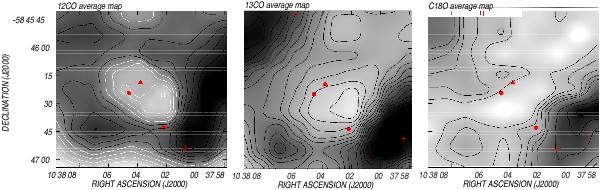
Left panel: average 12CO line emission Tmb−12 within the velocity interval from –27.1 to –19.9 km s-1. Contours go from 14 to 24 K, in steps of 1 K. Middle panel: average image of the 13CO line emission showing Tmb−13 within the velocity interval from –27.1 to –20.8 km s-1. Contours go from 3 to 10 K in steps of 0.5 K. Right panel: average image of the C18O line emission showing Tmb−18 within the velocity interval from –25.0 to –21.1 km s-1. Contours are 0.51, 0.68, 0.85, 1.02, 1.19, 1.70, 2.04, and 2.38 K. The triangle indicates the position of IRAS 10361-5530. The different symbols mark the location of candidate YSOs identified by CNAV08 and Ohlendorf et al. (2013): MSX sources (circles) and WISE sources (plus signs). White contours in the left panel correspond to Tmb ≤ 17 K.
Current usage metrics show cumulative count of Article Views (full-text article views including HTML views, PDF and ePub downloads, according to the available data) and Abstracts Views on Vision4Press platform.
Data correspond to usage on the plateform after 2015. The current usage metrics is available 48-96 hours after online publication and is updated daily on week days.
Initial download of the metrics may take a while.