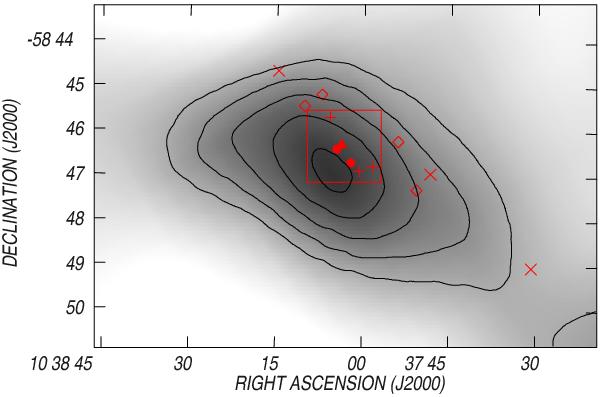
Fig. 1

12CO(1−0) line emission distribution toward clump number 6 from the list of Yonekura et al. (2005), in RA, Dec(J2000) coordinates, extracted from CNAV08. Contour lines go from 4.0 to 8.0 K in steps of 1 K. The 4.0 K contour delineates approximately the clump as defined in C18O. The grayscale goes from 0 to 10 K. The large square indicates the region observed in molecular lines with APEX (see Sect. 2.1). The triangle indicates the position of IRAS 10361-5530. The different symbols mark the location of candidate YSOs identified by CNAV08 and Ohlendorf et al. (2013): MSX sources (circles), 2MASS sources (crosses), Herschel sources (diamonds), and WISE sources (plus signs).
Current usage metrics show cumulative count of Article Views (full-text article views including HTML views, PDF and ePub downloads, according to the available data) and Abstracts Views on Vision4Press platform.
Data correspond to usage on the plateform after 2015. The current usage metrics is available 48-96 hours after online publication and is updated daily on week days.
Initial download of the metrics may take a while.


