Fig. 8
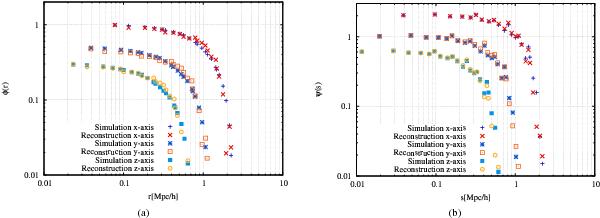
Reconstructed gravitational potentials in a) three and b) two dimensions are plotted as functions of radius and compared with the true potentials. In each panel, the blue, light blue and sky blue points show the true potential determined from the convergence map, while the red, orange and yellow points show the result of our reconstruction method. The corresponding relative deviation as a function of radius assuming the z-axis as a line of sight is shown in Fig. 9.
Current usage metrics show cumulative count of Article Views (full-text article views including HTML views, PDF and ePub downloads, according to the available data) and Abstracts Views on Vision4Press platform.
Data correspond to usage on the plateform after 2015. The current usage metrics is available 48-96 hours after online publication and is updated daily on week days.
Initial download of the metrics may take a while.