Free Access
Fig. 3
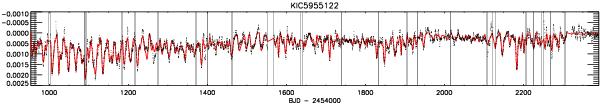
5335 data points from Q0 to Q16 fitted by a 33-spot model (red line). The light curve was divided into 25 parts, whose boundaries are indicated by vertical lines. The residuals are ± 0.16 mmag, i.e., 87.5% of the photometric variance is attributable to dark spots.
Current usage metrics show cumulative count of Article Views (full-text article views including HTML views, PDF and ePub downloads, according to the available data) and Abstracts Views on Vision4Press platform.
Data correspond to usage on the plateform after 2015. The current usage metrics is available 48-96 hours after online publication and is updated daily on week days.
Initial download of the metrics may take a while.