Fig. 8
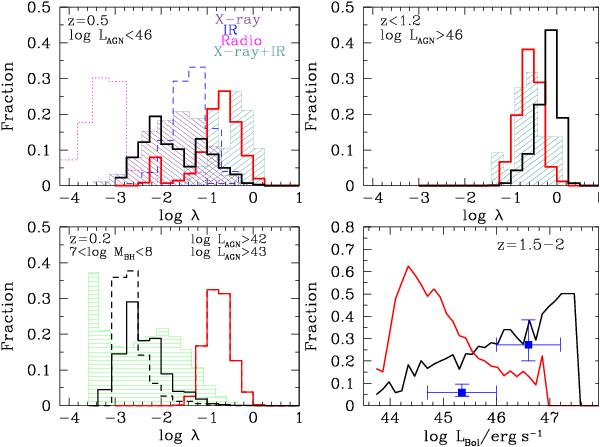
Top left panel: predicted distributions of the Eddington ratio λ in the IT (solid black line) and DI (solid red line) scenarios for AGN with bolometric luminosity LAGN< 1046 erg s-1 at z ≤ 0.5. They are compared with different sets of data (see text for details): a sample of X-ray-selected AGN (dashed violet histogram), of IR-selected (dashed histogram) and Radio selected AGN (dotted histogram) from Hickox et al. (2009), and the sub-sample of X-ray and IR AGN from Kollmeier et al. (2006, dark green histogram) corresponding to z ≤ 0.5. Top right panel: as above, but for luminous AGN with LAGN> 1046 erg s-1 at z ≤ 1.2. The dashed histogram represents observational results from Kollmeier et al. (2006). Bottom left panel: as above, but for AGN with BH masses in the range 107 M⊙ ≤ MBH ≤ 08 M⊙. Here we compare with data from Kauffmann & Heckman (2009, histogram). Bottom right panel: fraction of AGN with high Eddington ratios λ ≥ 0.5 as a function of the AGN bolometric luminosity LAGN, at z = 2. As above, the solid black line corresponds to the IT mode and the solid red line to the DI case. The points are computed from the data by Rosario et al. (2013a,b) shown in Fig. 7.
Current usage metrics show cumulative count of Article Views (full-text article views including HTML views, PDF and ePub downloads, according to the available data) and Abstracts Views on Vision4Press platform.
Data correspond to usage on the plateform after 2015. The current usage metrics is available 48-96 hours after online publication and is updated daily on week days.
Initial download of the metrics may take a while.