Fig. 4
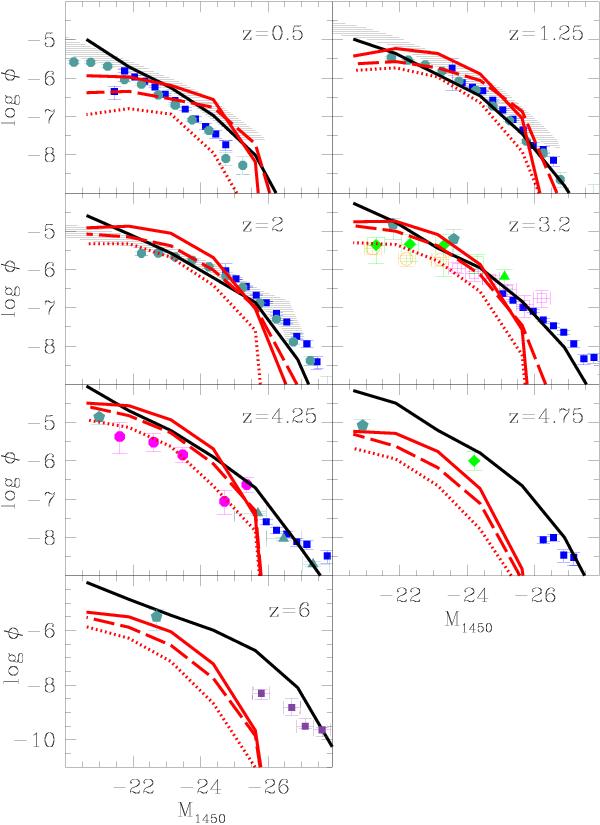
Predicted evolution of the AGN luminosity function in the UV band (at 1450 Å). Solid black lines refer to the IT scenario, and red solid lines to the DI model. We also plot variants of the DI model: dashed lines refer to the DI model computed with an exponential profile, while dotted lines to the DI model with increased star formation (see text). We compare with observed UV luminosity functions by Richards et al. (2006, solid squares), Croom et al. (2009, solid circles at z< 3 ), Siana et al. (2008, open squares), Bongiorno et al. (2007, open circles), Fontanot et al. (2007, solid diamonds), Glikman et al. (2011, big filled circles at z = 4.25), Jiang et al. (2009; solid squares at z ≥ 6). We also include luminosity functions from X-ray observations, converted to UV through the bolometric corrections in Marconi et al. (2004): the shaded region brackets the determinations derived in the X-ray band at z ≤ 2 by La Franca et al. (2005), Ebrero et al. (2009), Aird et al. (2010), while at higher redshifts we plot data from Fiore et al. (2012, penthagons), Brusa et al. (2010, triangle), Civano et al. (2011, green empty squares).
Current usage metrics show cumulative count of Article Views (full-text article views including HTML views, PDF and ePub downloads, according to the available data) and Abstracts Views on Vision4Press platform.
Data correspond to usage on the plateform after 2015. The current usage metrics is available 48-96 hours after online publication and is updated daily on week days.
Initial download of the metrics may take a while.