Fig. 3
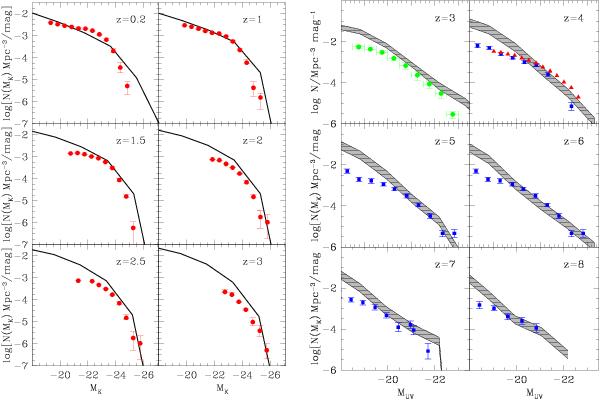
Left panels: evolution of the K-band luminosity function predicted by the model (solid line) compared with the data from Cirasuolo et al. (2010, squares). Right panels: predicted evolution of the UV luminosity function (shaded region) compared with observed distribution of dropout galaxies. The shaded region encompasses the uncertainties due to the adopted extinction curve (Small Magellanic Cloud, Milky Way or Calzetti) In each redshift bin, the model galaxies have been selected according to the same selection criterium as adopted in the observations (see text). Data are taken from Reddy & Steidel (2009, dots), Bouwens et al. (2007, 2011, squares), and van der Burg et al. (2010, triangles).
Current usage metrics show cumulative count of Article Views (full-text article views including HTML views, PDF and ePub downloads, according to the available data) and Abstracts Views on Vision4Press platform.
Data correspond to usage on the plateform after 2015. The current usage metrics is available 48-96 hours after online publication and is updated daily on week days.
Initial download of the metrics may take a while.