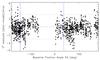
Fig. 9
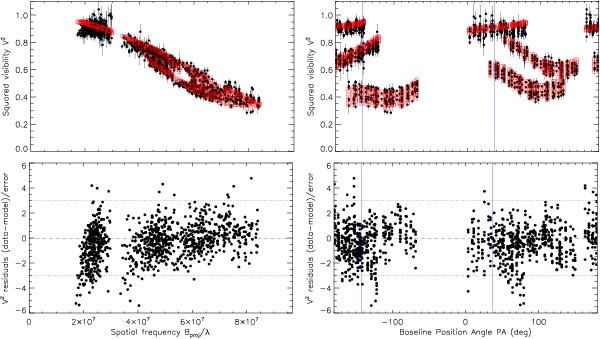
Top: squared visibilities V2 observed on Achernar (filled circles and error bars) and computed (opened squares) from the best-fit CHARRON model (Table 6) as a function of spatial frequency (left column) and baseline PA (right column). Bottom: V2 residuals from observations relative to the best-fit model in units of corresponding uncertainties. Vertical solid lines indicate the position angles of the visible (216.9° ≡ −143.1°) and hidden (16.9° = 216.9°−180°) stellar poles. The horizontal dotted lines delimit the ± 3σ region around zero (dashed line).
Current usage metrics show cumulative count of Article Views (full-text article views including HTML views, PDF and ePub downloads, according to the available data) and Abstracts Views on Vision4Press platform.
Data correspond to usage on the plateform after 2015. The current usage metrics is available 48-96 hours after online publication and is updated daily on week days.
Initial download of the metrics may take a while.