Fig. 8
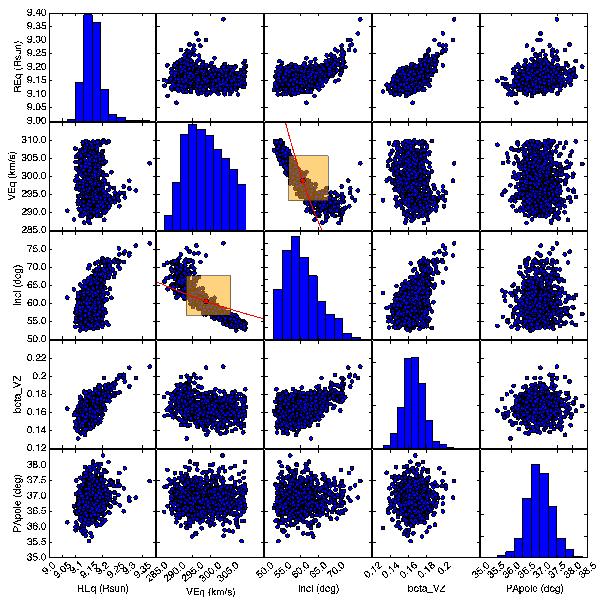
Histogram distributions and two-by-two correlations for the free parameters (Req, Veq, i, β, and PArot) of the best-fit CHARRON RVZ model determined with the emcee code (800 walkers). The mean values and associated uncertainties obtained from these histograms are given in Table 6. The parameters do not show strong correlations in the region defined by the uncertainty around the mean values. The stronger correlation is shown by Veq and i, which roughly follow a curve of constant Veqsini (=260.3 km s-1), represented by the solid lines, with the circles indicating the mean values in the histograms. The rectangles cover the corresponding uncertainty ranges on Veq and i.
Current usage metrics show cumulative count of Article Views (full-text article views including HTML views, PDF and ePub downloads, according to the available data) and Abstracts Views on Vision4Press platform.
Data correspond to usage on the plateform after 2015. The current usage metrics is available 48-96 hours after online publication and is updated daily on week days.
Initial download of the metrics may take a while.