Fig. 5
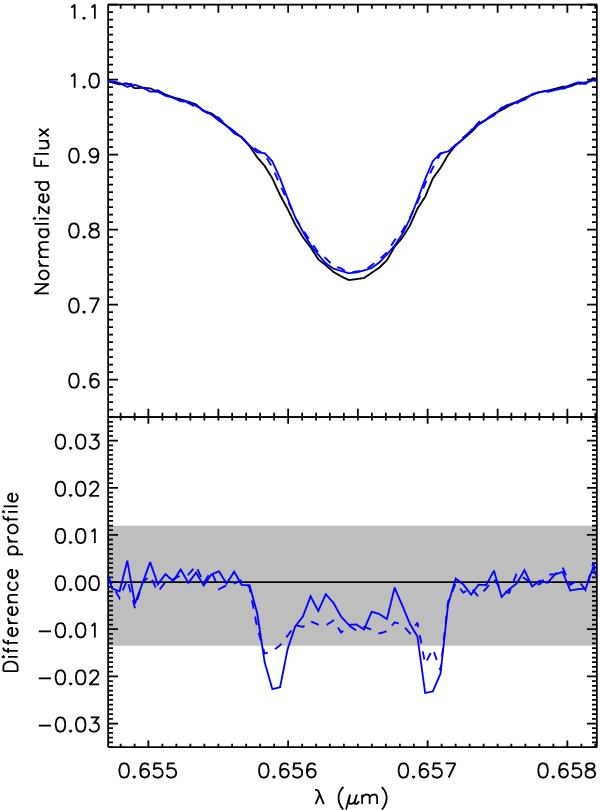
Top: Hα line profile for the pure photospheric model (black solid line) and with a residual disk (VDD model) as defined in Table 5 and computed for the upper limit values of ρ0 (cf. Fig. 4): 0.52 × 10⁻¹² g cm-3 (thin disk; blue solid line) and 0.65 × 10⁻¹² g cm-3 (thick disk; blue dashed line). Bottom: the difference between the disk models relative to the photospheric model. The observational limit set to the difference profiles defined in Sect. 3 is indicated by the shaded (gray) region.
Current usage metrics show cumulative count of Article Views (full-text article views including HTML views, PDF and ePub downloads, according to the available data) and Abstracts Views on Vision4Press platform.
Data correspond to usage on the plateform after 2015. The current usage metrics is available 48-96 hours after online publication and is updated daily on week days.
Initial download of the metrics may take a while.