Fig. 4
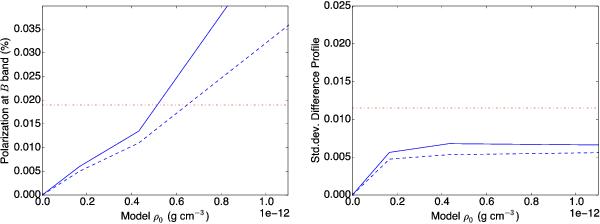
Polarization in the B band (left) and standard deviation of difference Hα profile (right) as a function of disk-base density ρ0 for the residual disk models from Table 5 (model 1: full line; model 2: dashed line). The standard deviation is the root mean square of the disk model spectrum minus the pure photospheric profile. The horizontal dot-dashed lines represent the observational limits of average polarization and difference profile determined from observations performed at the epoch of interferometric observations, as explained in Sect. 3. While the measured Hα difference profile level does not impose a limit to ρ0, the measured average polarization sets a strict upper limit to this quantity: ρ0< 0.52 × 10⁻¹² g cm-3 for the thin-disk model and ρ0< 0.65 × 10⁻¹² g cm-3 for the thick-disk model.
Current usage metrics show cumulative count of Article Views (full-text article views including HTML views, PDF and ePub downloads, according to the available data) and Abstracts Views on Vision4Press platform.
Data correspond to usage on the plateform after 2015. The current usage metrics is available 48-96 hours after online publication and is updated daily on week days.
Initial download of the metrics may take a while.