Fig. 3
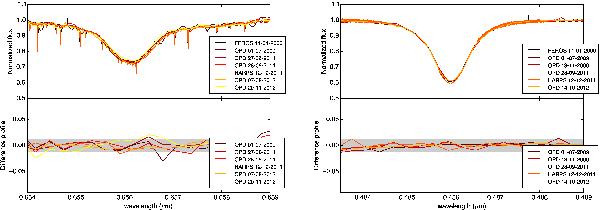
Top: Hα (left) and Hβ (right) line profiles of Achernar at the epoch of interferometric observations. Bottom: difference in flux of the line profiles with respect to the reference FEROS spectrum from 2000 Jan. 11. This spectrum can be considered as a good approximation to the pure photospheric profile of Achernar (Rivinius et al. 2013). Whenever possible (enough spectral resolution) the telluric lines seen in some spectra have been removed before computing the differences. The horizontal shaded (gray) areas indicate the typical error on the difference profiles and also set a limit to them.
Current usage metrics show cumulative count of Article Views (full-text article views including HTML views, PDF and ePub downloads, according to the available data) and Abstracts Views on Vision4Press platform.
Data correspond to usage on the plateform after 2015. The current usage metrics is available 48-96 hours after online publication and is updated daily on week days.
Initial download of the metrics may take a while.