Fig. 12
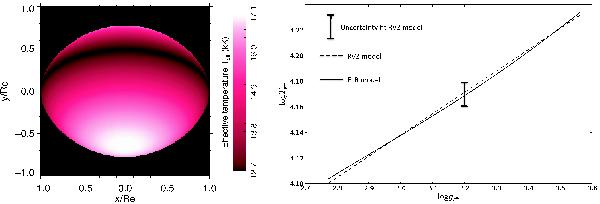
Left: effective temperature map of Achernar corresponding to the
best-fit of the CHARRON RVZ model to the VLTI/PIONIER H band observations
(model parameters in Table 6). The spatial
coordinates are normalized to the measured equatorial radius Req = 9.16
R⊙. The polar and equatorial
effective temperatures of Achernar are Tp = 17 124 K (white) and
Teq = 12
673 K (black). Right: log Teff
as a function of log geff of Achernar for the ELR
model (solid line from Espinosa Lara &
Rieutord 2011). The calculations were performed considering a Roche model
with the same stellar parameters as in Table 6, except for the gravity darkening, which is directly obtained from the
ELR model. The dashed straight line shows the log Teff
versus log geff corresponding to the
best-fit RVZ model with the measured gravity-darkening coefficient β (
= . The vertical bar
indicates the uncertainty in Teff associated with the measured
uncertainty in this best-fit β value alone. We also note that by fitting a
straight line to the ELR model (solid curve) results in an identical β (=0.166) as measured with the CHARRON
RVZ model, which exactly matches the dashed straight line. Thus, although the ELR
model predicts a slightly more complex gravity-darkening relation than the RVZ model
(Eq. (3)), these two
gravity-darkening models agree within the uncertainties derived from the RVZ model
fit to the PIONIER observations.
. The vertical bar
indicates the uncertainty in Teff associated with the measured
uncertainty in this best-fit β value alone. We also note that by fitting a
straight line to the ELR model (solid curve) results in an identical β (=0.166) as measured with the CHARRON
RVZ model, which exactly matches the dashed straight line. Thus, although the ELR
model predicts a slightly more complex gravity-darkening relation than the RVZ model
(Eq. (3)), these two
gravity-darkening models agree within the uncertainties derived from the RVZ model
fit to the PIONIER observations.

Current usage metrics show cumulative count of Article Views (full-text article views including HTML views, PDF and ePub downloads, according to the available data) and Abstracts Views on Vision4Press platform.
Data correspond to usage on the plateform after 2015. The current usage metrics is available 48-96 hours after online publication and is updated daily on week days.
Initial download of the metrics may take a while.