Fig. 10
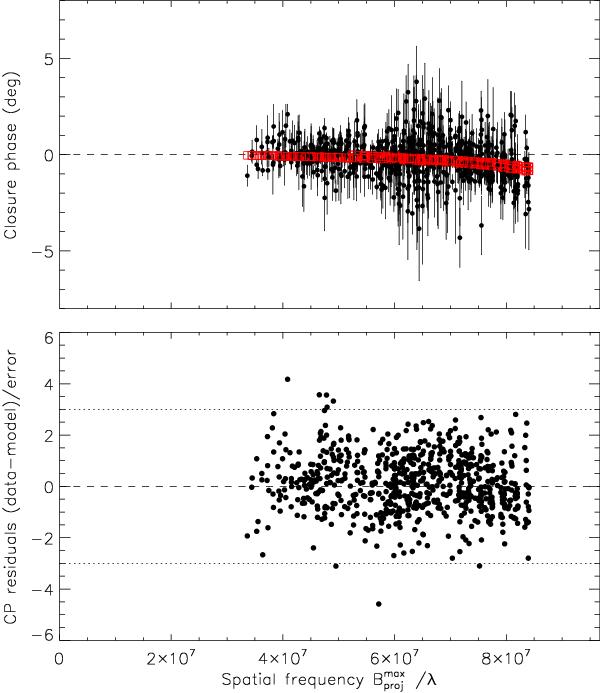
Top: closure phases (CP) observed on Achernar and computed from
the best-fit CHARRON model (Table 6) as a
function of the spatial frequency (for the longest projected baseline
 in the
corresponding triangle configuration). Bottom: CP residuals from
observations relative to the best-fit model in units of corresponding uncertainties.
The horizontal dotted lines delimit the ±3σ region around zero (dashed line). Since the
photosphere is only partially resolved, the CP signatures of fast rotation are weak
(within ~± 1°).
in the
corresponding triangle configuration). Bottom: CP residuals from
observations relative to the best-fit model in units of corresponding uncertainties.
The horizontal dotted lines delimit the ±3σ region around zero (dashed line). Since the
photosphere is only partially resolved, the CP signatures of fast rotation are weak
(within ~± 1°).
Current usage metrics show cumulative count of Article Views (full-text article views including HTML views, PDF and ePub downloads, according to the available data) and Abstracts Views on Vision4Press platform.
Data correspond to usage on the plateform after 2015. The current usage metrics is available 48-96 hours after online publication and is updated daily on week days.
Initial download of the metrics may take a while.