Free Access
Fig. 9
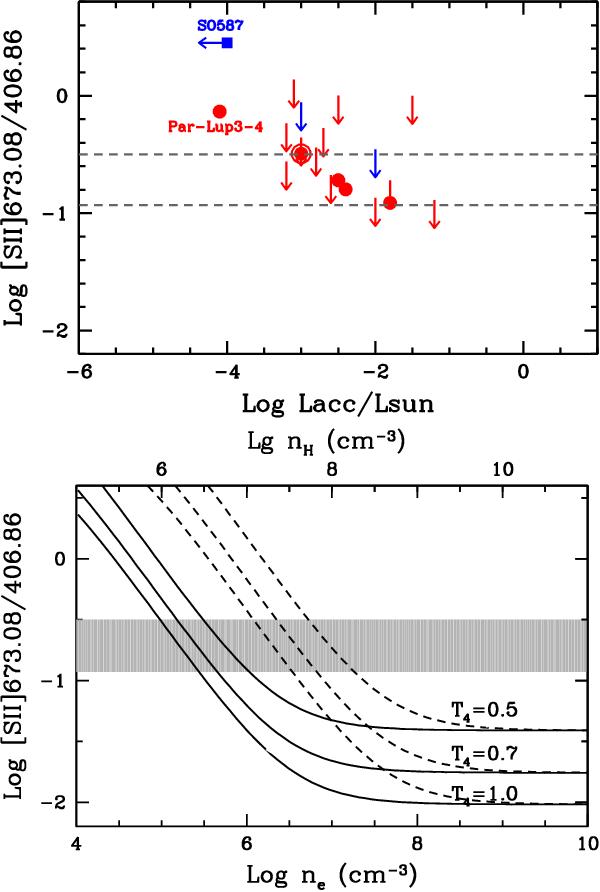
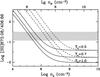
Same as Fig. 7 for the ratio of the LVC [S ii] 673.08/[S ii] 406.86. The shaded region in the bottom panel shows the locus of the four detections in the upper panel (excluding the special cases of Par-Lup3-4 and SO587, see text), between the two dashed lines in the top panel.
This figure is made of several images, please see below:
Current usage metrics show cumulative count of Article Views (full-text article views including HTML views, PDF and ePub downloads, according to the available data) and Abstracts Views on Vision4Press platform.
Data correspond to usage on the plateform after 2015. The current usage metrics is available 48-96 hours after online publication and is updated daily on week days.
Initial download of the metrics may take a while.