Fig. 7
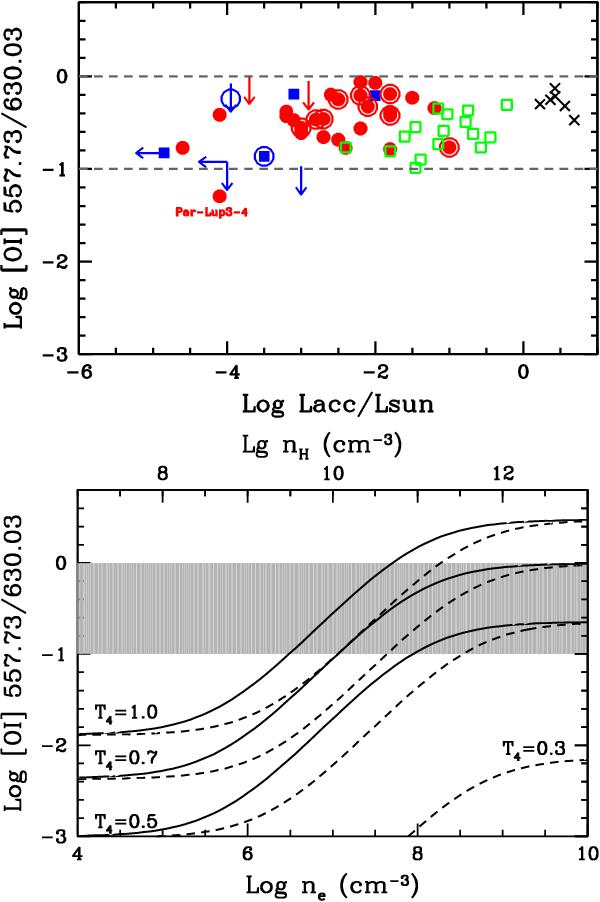
Top panel: ratio [O i] 557.79/[O i] 630.03 as function of Lacc for stars in Lupus (red dots) and σ Ori (filled blue squares). Arrows indicate 3σ upper limits. Objects where both a LVC and a HVC are detected are marked by large open circle. Black crosses show the values for the set of DR Tau spectra obtained at different epochs, and green open squares are stars in Taurus (see text). Bottom panel: model predictions for collisions with electron (solid curves) and with hydrogen atoms (dashed curves). Different curves refer to different temperatures in units of 104 K, as labeled. The ne scale is shown in the bottom axis, that for nH on the top axis. The gray area shows the location of the observed values, marked by the two dashed lines in the top panel.
Current usage metrics show cumulative count of Article Views (full-text article views including HTML views, PDF and ePub downloads, according to the available data) and Abstracts Views on Vision4Press platform.
Data correspond to usage on the plateform after 2015. The current usage metrics is available 48-96 hours after online publication and is updated daily on week days.
Initial download of the metrics may take a while.