Fig. 6
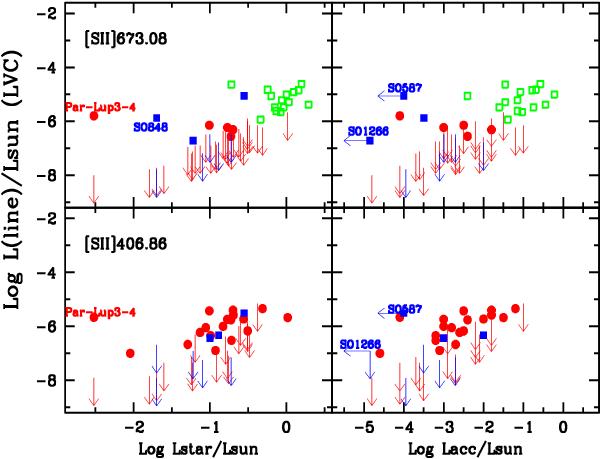
Line luminosities for the [S ii] 406.86 and [S ii] 673.08 lines are plotted as functions of the stellar luminosity (left panels) and of the accretion luminosity (right panels). Red dots are the Lupus objects, blue filled squares are objects in σ Ori, arrows show 3σ upper limits. Green open squares show the position of Taurus TTS from Gullbring et al. (1998) and Hartigan et al. (1995), as described in the text.
Current usage metrics show cumulative count of Article Views (full-text article views including HTML views, PDF and ePub downloads, according to the available data) and Abstracts Views on Vision4Press platform.
Data correspond to usage on the plateform after 2015. The current usage metrics is available 48-96 hours after online publication and is updated daily on week days.
Initial download of the metrics may take a while.