Fig. 5
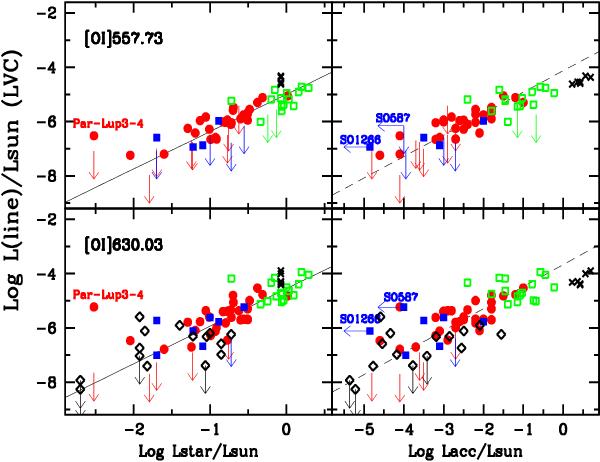
Line luminosities for [O i] 630.03 and [O i] 557.79 are plotted as functions of the stellar luminosity (left panels) and of the accretion luminosity (right panels). Red filled dots are the Lupus objects, blue filled squares are objects in σ Ori, arrows show 3σ upper limits. The black crosses show the same quantities for the strongly accreting TTS DR Tau at different epochs (Banzatti et al. 2014). Black diamonds are values for Taurus very low-mass objects from Herczeg & Hillenbrand (2008, 2014, see text); green open squares denote Taurus TTS from Gullbring et al. (1998) and Hartigan et al. (1995), as described in the text. A few objects discussed in Sect. 6.2 are only labeled in some panels, to avoid confusion. Black lines show the relations derived in Eqs.(1)–(4) for the GTO sample.
Current usage metrics show cumulative count of Article Views (full-text article views including HTML views, PDF and ePub downloads, according to the available data) and Abstracts Views on Vision4Press platform.
Data correspond to usage on the plateform after 2015. The current usage metrics is available 48-96 hours after online publication and is updated daily on week days.
Initial download of the metrics may take a while.