Free Access
Fig. C.2
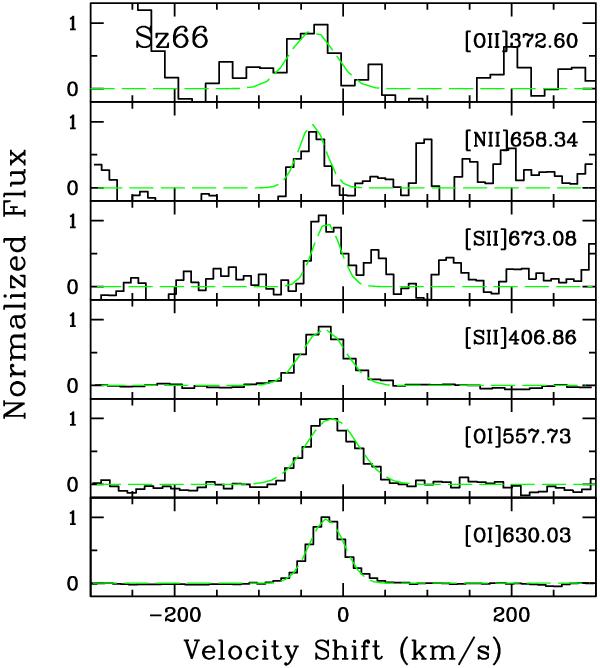
Normalized, continuum subtracted line profiles (as labeled) for the object Sz66. In this and the following figures the dashed colored curves show the LVC (green), HVC blueshifted (blue) and HVC redshifted (red); the total is given by the dotted (black) line. In this object, only the LVC is detected.
Current usage metrics show cumulative count of Article Views (full-text article views including HTML views, PDF and ePub downloads, according to the available data) and Abstracts Views on Vision4Press platform.
Data correspond to usage on the plateform after 2015. The current usage metrics is available 48-96 hours after online publication and is updated daily on week days.
Initial download of the metrics may take a while.