Fig. 11
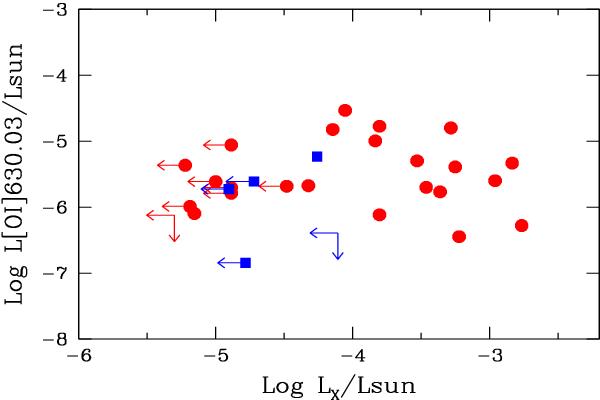
Luminosity of the [O i] 630.03 line plotted as a function of X-ray luminosity, when available, for the GTO sample. Red dots are the Lupus objects, blue filled squares are objects in σ Ori. The X-ray luminosities were collected from the ROSAT observations by Krautter et al. (1997) for Lupus and from the XMM-Newton observations by Franciosini et al. (2006) for σ Ori.
Current usage metrics show cumulative count of Article Views (full-text article views including HTML views, PDF and ePub downloads, according to the available data) and Abstracts Views on Vision4Press platform.
Data correspond to usage on the plateform after 2015. The current usage metrics is available 48-96 hours after online publication and is updated daily on week days.
Initial download of the metrics may take a while.