Fig. 3
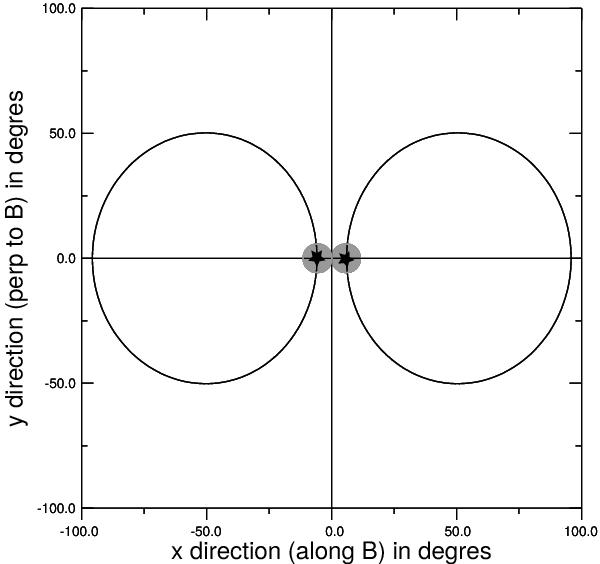
Directions of the radio waves in the observer’s frame. The two smaller tangent grey disks in the middle of the plot correspond to the waves that are beamed at ≤90° from the Alfvén wing axis in the source frame in the approximation of very high γ values (see text for the precise meaning of “very high”). The two large circles (black lines) are the radio-beaming patterns associated with the CMI. They are defined by x = δ± + θocosϕo and y = θosinϕo, with θo and ϕo the cylindrical angular coordinates of the wave vector in the observer’s reference frame of each Alfvén wing. θo and ϕo are related via Eq. (10) (or Eq. (13)) to the wave vector coordinates in the source frame θs and ϕs given by Eq. (12). The most intense emissions correspond to the innermost intersection of each large circle with the horizontal axis. Here γ = 10, r = 0.1 AU and αs = 85°. With these parameters, x = 78. The stars mark the directions of the most intense radio emissions.
Current usage metrics show cumulative count of Article Views (full-text article views including HTML views, PDF and ePub downloads, according to the available data) and Abstracts Views on Vision4Press platform.
Data correspond to usage on the plateform after 2015. The current usage metrics is available 48-96 hours after online publication and is updated daily on week days.
Initial download of the metrics may take a while.