Fig. 1
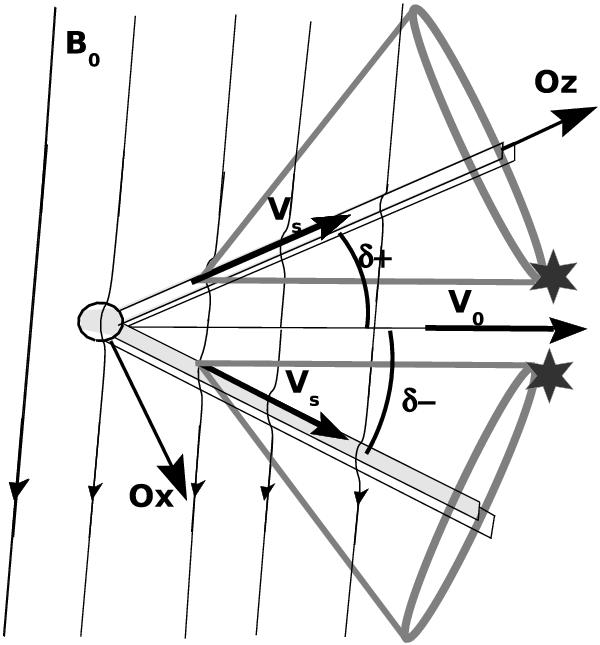
Alfvénic wake of the pulsar’s companion body seen from above the equatorial plane. The velocity of the source regions Vs is assumed to be along the Alfvén wings. The thick grey lines represent the cones in which emitted radio waves are focussed. We call them the angular emission patterns. The observer’s frame related to the upper wing on the figure (making an angle δ+ with the wind) is indicated by the Ox and Oz axes. It is fixed relative to the pulsar companion. The two stars mark the region of the angular emission patterns of highest wave intensity (see Sect. 4).
Current usage metrics show cumulative count of Article Views (full-text article views including HTML views, PDF and ePub downloads, according to the available data) and Abstracts Views on Vision4Press platform.
Data correspond to usage on the plateform after 2015. The current usage metrics is available 48-96 hours after online publication and is updated daily on week days.
Initial download of the metrics may take a while.