Fig. 3
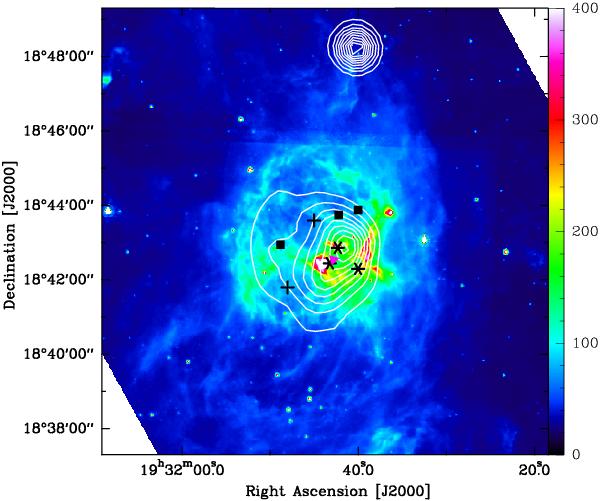
1.4 GHz radio continuum emission contours (white) overlayed on the Spitzer-IRAC 8 μm emission map (color scale). The white contour levels are 20, 35, ..., 95% of the peak value (0.3 Jy beam-1). Two black crosses indicate N116 and N117, and the “∗” show three HII regions. The EGO sources are labeled as the filled square symbols. The pink triangle represents the IRAS 19294+1836 source. The color bar is in units of MJy sr-1.
Current usage metrics show cumulative count of Article Views (full-text article views including HTML views, PDF and ePub downloads, according to the available data) and Abstracts Views on Vision4Press platform.
Data correspond to usage on the plateform after 2015. The current usage metrics is available 48-96 hours after online publication and is updated daily on week days.
Initial download of the metrics may take a while.