Fig. 1
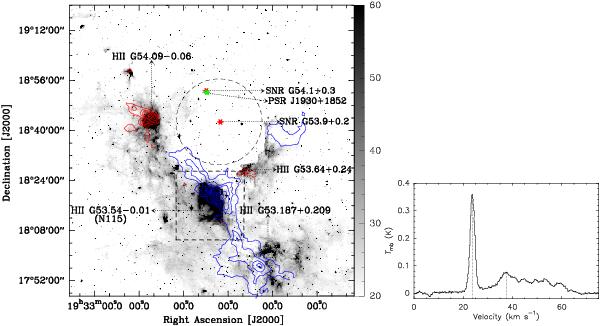
Left panel: 13CO J = 1−0 integrated intensity contours (blue and red) overlayed on the Spitzer-IRAC 8 μm emission map (gray scale). The blue contour levels are 20, 35, ..., 95% of the peak value (19.9 K km s-1) integrated from 20−28 km s-1, while the red contour levels are 20, 35, ..., 95% of the peak value (26.1 K km s-1) integrated from 35−43 km s-1. The different sources associated with the region are marked. The red and green stars represent the center of SNRs and PSR. The radius of the radio shell is 14′ outlined by a dashed circle. The dashed square frame marks the area observed with PMO telescope. The gray bar is in units of MJy sr-1. Right panel: average spectra of 13CO J = 1−0 over the whole large-scale infrared bubble. The vertical dashed lines in the spectra mark the peak velocity.
Current usage metrics show cumulative count of Article Views (full-text article views including HTML views, PDF and ePub downloads, according to the available data) and Abstracts Views on Vision4Press platform.
Data correspond to usage on the plateform after 2015. The current usage metrics is available 48-96 hours after online publication and is updated daily on week days.
Initial download of the metrics may take a while.